Multiple Choice
Figure 11-3
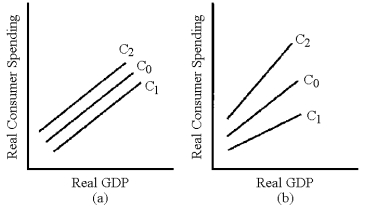
-In Figure 11-3,which line represents the change in the consumption schedule caused by an increase in the residential property tax?
A) C1 in graph (a)
B) C2 in graph (a)
C) C1 in graph (b)
D) C2 in graph (b)
Correct Answer:

Verified
Correct Answer:
Verified
Q54: _ is the income actually available to
Q67: Changes in government spending<br>A)are an indirect component
Q88: If all variable taxes in the United
Q99: Figure 11-2<br> <img src="https://d2lvgg3v3hfg70.cloudfront.net/TB8592/.jpg" alt="Figure 11-2
Q109: Contractionary fiscal policy may have some undesirable
Q164: If income tax rates are increased in
Q166: If personal income tax rates are decreased
Q172: In the determination of disposable income, transfer
Q180: Table 11-1 <img src="https://d2lvgg3v3hfg70.cloudfront.net/TB8592/.jpg" alt="Table 11-1
Q208: Income taxes and transfer payments help prevent