Multiple Choice
Figure 20-8
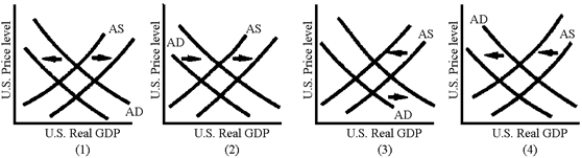
-Which of the graphs in Figure 20-8 illustrates the AD-AS shifts induced by the foreign sector following an increase in the U.S.federal deficit?
A) 1
B) 2
C) 3
D) 4
Correct Answer:

Verified
Correct Answer:
Verified
Related Questions
Q2: A currency depreciation is usually inflationary.
Q5: The trade deficit is the mirror image
Q8: Figure 20-2<br> <img src="https://d2lvgg3v3hfg70.cloudfront.net/TB2282/.jpg" alt="Figure 20-2
Q10: Figure 20-5<br> <img src="https://d2lvgg3v3hfg70.cloudfront.net/TB2282/.jpg" alt="Figure 20-5
Q55: Foreign trade will have no impact on
Q80: An increase in the value of the
Q113: Which of the following is correct?<br>A)Current account
Q133: What are the economic effects of a
Q136: A fall in the domestic interest rate
Q154: In an open economy, an increase in