Multiple Choice
This diagram shows hypothetical demand curves for individuals A and B.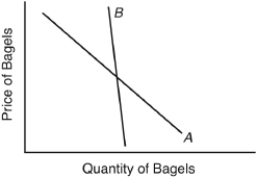
The differences in their slopes suggest that consumer A and consumer B
A) have very different income levels.
B) have different tastes.
C) are not subject to the law of diminishing marginal utility.
D) are charged different prices for the same commodity.
E) are offered different amounts to purchase.
Correct Answer:

Verified
Correct Answer:
Verified
Q63: A rising marginal cost curve reflects a
Q64: A rising marginal cost curve intersects the<br>A)
Q65: The following question are based on the
Q66: The next question is based on the
Q67: In the short run,a firm's total costs
Q69: Approximately what percentage of their income do
Q70: The law of diminishing marginal utility means
Q71: If the marginal utility of food divided
Q72: A consumer buying food and clothing is
Q73: The following question are based on the