Multiple Choice
The following question are based on the following graph:
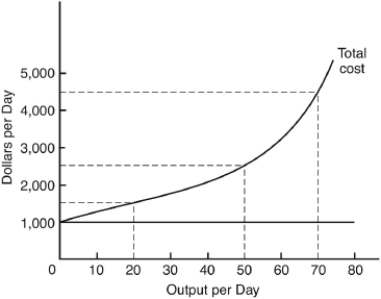
-At 70 units of output per day,total variable cost is
A) $1,000.
B) $1,500.
C) $2,500.
D) $3,500.
E) $4,500.
Correct Answer:

Verified
Correct Answer:
Verified
Related Questions
Q60: The following question are based on the
Q61: The following question are based on the
Q62: Costs of owner-supplied resources are _ costs.<br>A)
Q63: A rising marginal cost curve reflects a
Q64: A rising marginal cost curve intersects the<br>A)
Q66: The next question is based on the
Q67: In the short run,a firm's total costs
Q68: This diagram shows hypothetical demand curves for
Q69: Approximately what percentage of their income do
Q70: The law of diminishing marginal utility means