Multiple Choice
The figure given below represents the saving function of an economy.
Figure 9.1
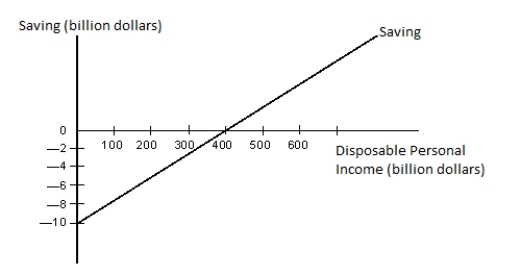
-Refer to Figure 9.1. Which of the following statements is true for real GDP levels below $400 billion?
A) Saving exists because consumption is smaller than disposable income.
B) Saving does not exist because consumption exceeds disposable income.
C) The corresponding section of the consumption function lies below the 45-degree line.
D) Autonomous consumption is equal to zero.
E) The slope of the consumption function becomes negative.
Correct Answer:

Verified
Correct Answer:
Verified
Q9: In the table given below Y
Q11: The figure given below shows the consumption
Q15: What would be the impact of an
Q18: Other things equal, a marginal propensity to
Q21: An increase in disposable income will cause
Q39: Other things equal, a decrease in the
Q45: If a household's disposable income increases from
Q66: The second-largest component of aggregate expenditures in
Q93: The marginal propensity to consume (MPC)is equal
Q98: The consumption function becomes flatter if:<br>A)the average