Multiple Choice
The figure given below represents the saving function of an economy.
Figure 9.1
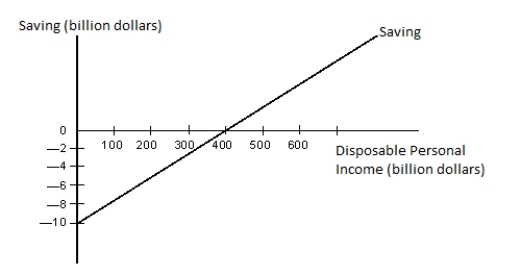
-Refer to Figure 9.1. At the real GDP level of $400 billion, which of the following statements is true?
A) There is dissaving.
B) Saving is equal to $10 billion.
C) Consumption is equal to disposable income.
D) The slope of the saving function is equal to zero.
E) The slope of the consumption function is equal to zero.
Correct Answer:

Verified
Correct Answer:
Verified
Q9: In the table given below Y
Q11: The figure given below shows the consumption
Q14: In the table given below Y
Q16: In the table given below Y
Q18: Other things equal, a marginal propensity to
Q21: An increase in disposable income will cause
Q66: The second-largest component of aggregate expenditures in
Q77: The sum of the MPC and the
Q78: The consumption function has a positive slope
Q89: Identify the correct statement with respect to