Multiple Choice
The figure given below shows the consumption functions of an economy.?Figure 9.4
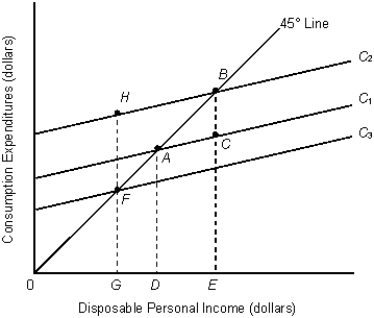
-Refer to Figure 9.4. Which of the following could explain a downward shift of the consumption function from C₁ to C₃?
A) An increase in household wealth
B) A decrease in the proportion of young people in the population
C) An increase in the size of the population
D) A decrease in consumer confidence
E) An autonomous decrease in saving
Correct Answer:

Verified
Correct Answer:
Verified
Q3: The figure given below represents the saving
Q7: Suppose that the consumption function crosses the
Q13: If it is assumed that there are
Q40: Which of the following variables do not
Q45: The figure given below represents the consumption
Q74: Suppose two successive levels of disposable personal
Q78: The consumption function has a positive slope
Q93: The marginal propensity to consume (MPC)is equal
Q102: Which of the following is a determinant
Q108: The figure given below represents the consumption