Multiple Choice
The figure given below represents the new classical long run and short run Phillips curve measuring inflation rate on vertical axis and unemployment rate on horizontal axis.
Figure 15.2
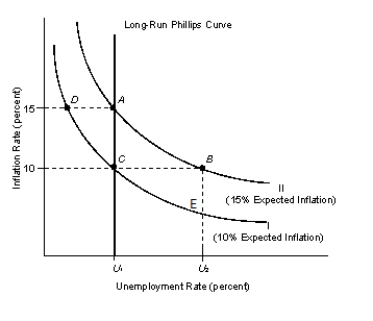
-Refer to Figure 15.2. Assume that the government adopted an unexpected expansionary monetary policy that has the economy currently at point D. If people expect that this inflation rate will persist next year, the economy will now:
A) move to point A.
B) move to point B.
C) move to point C.
D) move to point E.
E) remain at point D.
Correct Answer:

Verified
Correct Answer:
Verified
Q33: In traditional Keynesian economics:<br>A)the aggregate supply curve
Q34: If the traditional Keynesian views turn out
Q35: Suppose the central bank increases the money
Q37: Which of the following economic theories favors
Q44: Milton Friedman is widely considered to be
Q60: Monetarists argue that government actions, particularly monetary
Q70: Monetarists believe that changes in monetary policy
Q80: The main reason why the traditional classical
Q86: In the early 1960s, monetary theory rather
Q94: The figure given below represents the new