Multiple Choice
The figure given below depicts the demand and supply of Brazilian reals in the foreign exchange market. Assume that the market operates under a flexible exchange rate regime.
Figure 21.1
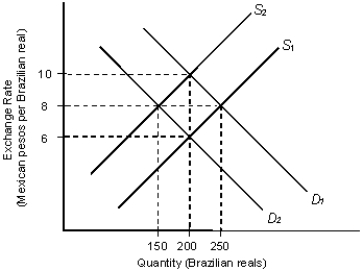
In the figure:
D1 and D2: Demand for Brazilian reals
S1 and S2: Supply of Brazilian reals
-Refer to Figure 21.1. Suppose the initial equilibrium exchange rate is 10 pesos per real. A decrease in the Mexican demand for Brazilian coffee, other things equal, is most likely to result in a new equilibrium exchange rate of:
A) 6 pesos per real and an equilibrium quantity of 200 Brazilian reals.
B) 6 pesos per real and an equilibrium quantity of 250 Brazilian reals.
C) 8 pesos per real and an equilibrium quantity of 150 Brazilian reals.
D) 8 pesos per real and an equilibrium quantity of 100 Brazilian reals.
E) 10 pesos per real and an equilibrium quantity of 200 Brazilian reals.
Correct Answer:

Verified
Correct Answer:
Verified
Q12: The figure given below depicts the foreign
Q33: The figure given below depicts the foreign
Q46: The figure given below depicts the foreign
Q51: The figure given below depicts the foreign
Q57: The figure given below depicts the foreign
Q62: The figure given below depicts the foreign
Q104: The figure given below depicts the demand
Q105: The figure below shows the demand (D)
Q113: The figure below shows the demand (D)
Q115: The figure given below depicts the foreign