Multiple Choice
The figure given below depicts the demand and supply of Brazilian reals in the foreign exchange market. Assume that the market operates under a flexible exchange rate regime.?Figure 21.1??In the figure:?D₁ and D₂: Demand for Brazilian reals?S₁ and S₂: Supply of Brazilian reals
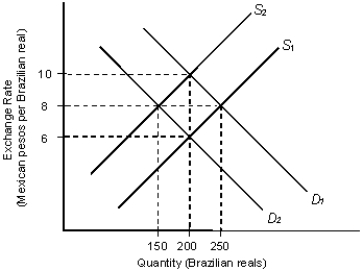
-Refer to Figure 21.1. If the initial equilibrium exchange rate is 6 pesos per real, then other things equal, a decrease in the number of Brazilian tourists to Mexico would:
A) increase the demand for Brazilian reals from D₂ to D₁ and increase the exchange rate to 8 pesos per real.
B) decrease the supply of Brazilian reals from S₁ to S₂ and increase the exchange rate to 8 pesos per real.
C) decrease the supply of Brazilian reals from S₁ to S₂ and increase the exchange rate to 10 pesos per real.
D) decrease the demand for Brazilian reals from D₁ to D₂ and increase the exchange rate to 8 pesos per real.
E) decrease the supply of Brazilian reals from S₁ to S₂ and increase the demand for Brazilian reals from D₂ to D₁, thereby changing the exchanging rate to 10 pesos per real.
Correct Answer:

Verified
Correct Answer:
Verified
Q8: The figure given below depicts the foreign
Q29: The figure given below depicts the foreign
Q46: The figure given below depicts the foreign
Q54: The figure given below depicts the foreign
Q68: When the exchange rate moves from $1
Q72: The figure given below depicts the foreign
Q75: The figure given below depicts the foreign
Q82: The figure given below depicts the foreign
Q117: The figure given below depicts the foreign
Q124: The figure given below depicts the foreign