Multiple Choice
The figure given below depicts the foreign exchange market for British pounds traded for U.S. dollars.?Figure 21.2
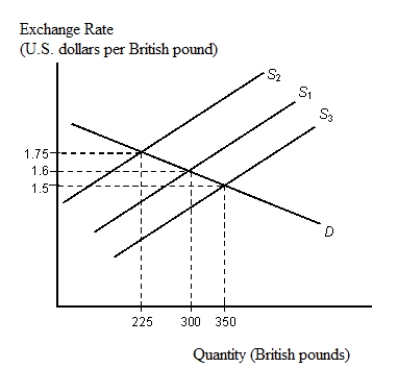
-Refer to Figure 21.2. Suppose that the British central bank wishes to maintain a fixed exchange rate of £1 = $1.60. If supply decreases from S₁ to S₂, the bank must:
A) buy 25 pounds to shift the supply curve from S₂ to S₁.
B) buy 50 pounds to shift the supply curve from S₂ to S₁.
C) sell 75 pounds to shift the supply curve from S₂ to S₁.
D) buy 75 pounds to shift the supply curve from S₂ to S₁.
E) sell 10 pounds to shift the supply curve from S₂ to S₁.
Correct Answer:

Verified
Correct Answer:
Verified
Q8: The figure given below depicts the foreign
Q46: The figure given below depicts the foreign
Q54: The figure given below depicts the foreign
Q68: When the exchange rate moves from $1
Q71: The figure given below depicts the demand
Q75: The figure given below depicts the foreign
Q82: The figure given below depicts the foreign
Q103: The figure given below depicts the foreign
Q117: The figure given below depicts the foreign
Q124: The figure given below depicts the foreign