Essay
The income levels vary by race and educational attainment. To examine this inequality in the income, data have been collected for 7 different years on the median income earned by an individual based on the race and education.

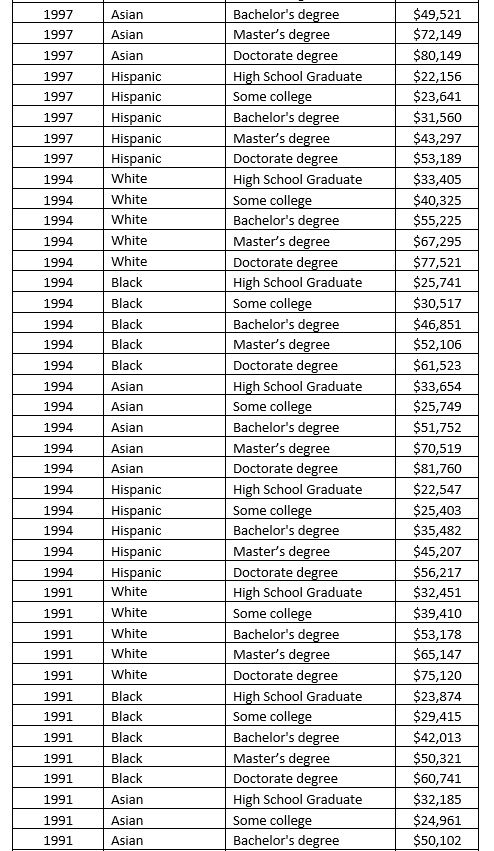
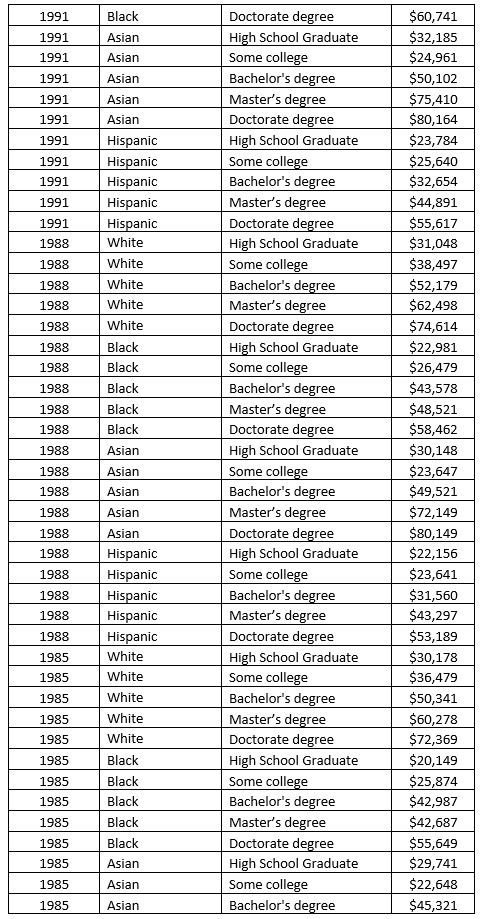
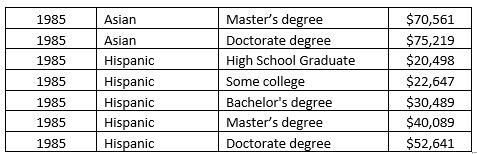
a. Sort the PivotTable data to display the years with the smallest sum of median income on top and the largest on the bottom. Which year had the smallest sum of median income? What is the total income in the year with the smallest sum of median income?
b. Add the Racial Demographic to the Row Labels in the PivotTable. Sort the Racial Demographic by Sum of Median Income with the lowest values on top and the highest values on bottom. Filter the Row Labels so that only the year 2003 is displayed. Which Racial demography had the smallest sum of median income in the year 2003? Which Racial demography had the largest sum of median income in the year 2003?
Correct Answer:

Verified
To sort data in a PivotTable in Excel, r...View Answer
Unlock this answer now
Get Access to more Verified Answers free of charge
Correct Answer:
Verified
View Answer
Unlock this answer now
Get Access to more Verified Answers free of charge
Q9: _ merges maps and statistics to present
Q21: The charts that are helpful in making
Q27: A useful type of table for describing
Q29: Tables should be used when<br>A) the reader
Q30: A line chart displaying the data values
Q33: A data visualization tool that updates in
Q34: The size of the bubble in a
Q34: Using multiple lines on a line chart
Q35: The total number of runs scored by
Q44: A _ is a line that provides