Essay
The total number of runs scored by the players in the previous problem is 198. The following pie chart shows the percentage of runs scored by each player:
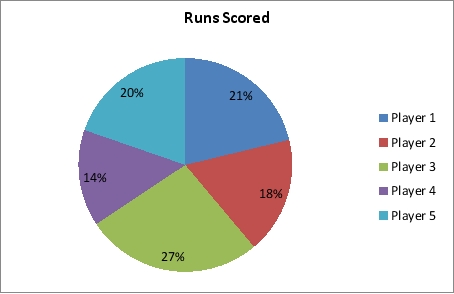
a. What are the problems with using a pie chart to display these data?
b. What type of chart would be preferred for displaying the data in this pie chart?
c. Use a different type of chart to display the percentage of runs scored by each player that conveys the data better than the pie chart. Format the chart and add data labels to improve the chart's readability.
Correct Answer:

Verified
a. In the pie chart, it is difficult to ...View Answer
Unlock this answer now
Get Access to more Verified Answers free of charge
Correct Answer:
Verified
View Answer
Unlock this answer now
Get Access to more Verified Answers free of charge
Q15: We create multiple dashboards<br>A)to help the user
Q30: A line chart displaying the data values
Q31: The income levels vary by race and
Q33: A data visualization tool that updates in
Q34: The size of the bubble in a
Q34: Using multiple lines on a line chart
Q37: In order to visualize three variables in
Q38: The data on the runs scored in
Q40: A chart similar to a scatter chart,
Q44: A _ is a line that provides