Multiple Choice
Exhibit 10.1
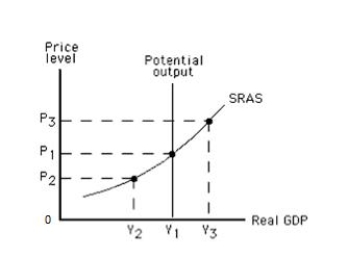
-Refer to Exhibit 10.1, which shows the short-run aggregate supply (SRAS) curve of an economy. To the left of Y₁, _____
A) output levels are at the economy's potential.
B) output levels are more than the economy's potential.
C) output levels are less than the economy's potential.
D) unemployment is at the natural rate.
E) unemployment is lower than the natural rate.
Correct Answer:

Verified
Correct Answer:
Verified
Q50: During a particular year,nominal wages increased by
Q147: An increase in the federal minimum wage
Q179: From 2010 to 2016, _<br>A) real GDP
Q180: The nominal wage represents _<br>A) the wage
Q181: How much is the output gap if
Q182: Exhibit 10.1<br> <img src="https://d2lvgg3v3hfg70.cloudfront.net/TB1006/.jpg" alt="Exhibit 10.1
Q185: Exhibit 10.7<br> <img src="https://d2lvgg3v3hfg70.cloudfront.net/TB1006/.jpg" alt="Exhibit 10.7
Q186: Exhibit 10.1<br> <img src="https://d2lvgg3v3hfg70.cloudfront.net/TB1006/.jpg" alt="Exhibit 10.1
Q187: Exhibit 10.9<br> <img src="https://d2lvgg3v3hfg70.cloudfront.net/TB1006/.jpg" alt="Exhibit 10.9
Q189: Exhibit 10.1<br> <img src="https://d2lvgg3v3hfg70.cloudfront.net/TB1006/.jpg" alt="Exhibit 10.1