Multiple Choice
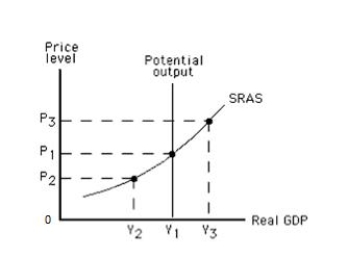
Exhibit 10.1

-Refer to Exhibit 10.1, which shows the short-run aggregate supply (SRAS) curve of an economy. At Y₃, _____
A) output levels are at the economy's potential.
B) output levels are less than the economy's potential.
C) unemployment is at the natural rate.
D) unemployment is higher than the natural rate.
E) unemployment is lower than the natural rate.
Correct Answer:

Verified
Correct Answer:
Verified
Q1: Which of the following is true of
Q22: Which of the following occurs when an
Q83: Potential output is the amount produced when:<br>A)firms'
Q147: An increase in the federal minimum wage
Q184: Exhibit 10.1<br> <img src="https://d2lvgg3v3hfg70.cloudfront.net/TB1006/.jpg" alt="Exhibit 10.1
Q185: Exhibit 10.7<br> <img src="https://d2lvgg3v3hfg70.cloudfront.net/TB1006/.jpg" alt="Exhibit 10.7
Q186: Exhibit 10.1<br> <img src="https://d2lvgg3v3hfg70.cloudfront.net/TB1006/.jpg" alt="Exhibit 10.1
Q187: Exhibit 10.9<br> <img src="https://d2lvgg3v3hfg70.cloudfront.net/TB1006/.jpg" alt="Exhibit 10.9
Q192: The long run is the period of
Q193: If the price level in an economy