Multiple Choice
Exhibit 10.2
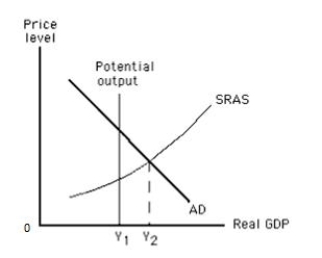
-Refer to Exhibit 10.2, which shows the short-run aggregate supply curve of an economy. In this Exhibit, the distance between Y₁ and Y₂ represents _____
A) an expansionary gap.
B) a recessionary gap.
C) cost-push inflation.
D) the natural rate of unemployment.
E) the full-employment output.
Correct Answer:

Verified
Correct Answer:
Verified
Q27: The capital stock of an economy increases
Q28: Exhibit 10.3<br> <img src="https://d2lvgg3v3hfg70.cloudfront.net/TB1006/.jpg" alt="Exhibit 10.3
Q29: Exhibit 10.1<br> <img src="https://d2lvgg3v3hfg70.cloudfront.net/TB1006/.jpg" alt="Exhibit 10.1
Q31: In the long run, the price level
Q33: Table 10.2<br> <img src="https://d2lvgg3v3hfg70.cloudfront.net/TB1006/.jpg" alt="Table 10.2
Q34: Exhibit 10.9<br> <img src="https://d2lvgg3v3hfg70.cloudfront.net/TB1006/.jpg" alt="Exhibit 10.9
Q35: Which of the following is most likely
Q36: Table 10.1<br> <span class="ql-formula" data-value="\begin{array}{l}\text
Q37: How much is the output gap if
Q45: Suppose the real wage remains unchanged between