Multiple Choice
Exhibit 10.9
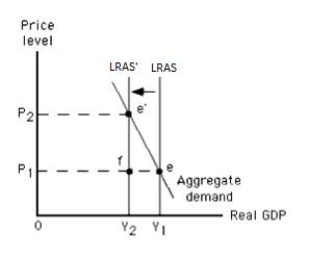
-Refer to Exhibit 10.9, which shows the long-run equilibrium in the aggregate demand-aggregate supply model. The movement from Y₁ to Y₂ in this exhibit could have been caused by a(n) _____
A) decrease in the size of the labor force.
B) decrease in the price level.
C) positive level of net investment.
D) increase in autonomous consumption.
E) decrease in autonomous consumption.
Correct Answer:

Verified
Correct Answer:
Verified
Q29: Exhibit 10.1<br> <img src="https://d2lvgg3v3hfg70.cloudfront.net/TB1006/.jpg" alt="Exhibit 10.1
Q31: In the long run, the price level
Q32: Exhibit 10.2<br> <img src="https://d2lvgg3v3hfg70.cloudfront.net/TB1006/.jpg" alt="Exhibit 10.2
Q33: Table 10.2<br> <img src="https://d2lvgg3v3hfg70.cloudfront.net/TB1006/.jpg" alt="Table 10.2
Q35: Which of the following is most likely
Q36: Table 10.1<br> <span class="ql-formula" data-value="\begin{array}{l}\text
Q37: How much is the output gap if
Q38: An expansionary gap is closed in the
Q39: Exhibit 10.8<br> <img src="https://d2lvgg3v3hfg70.cloudfront.net/TB1006/.jpg" alt="Exhibit 10.8
Q45: Suppose the real wage remains unchanged between