Multiple Choice
Exhibit 10.6
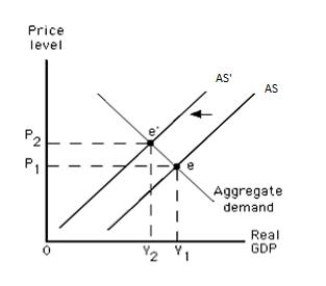
-Refer to Exhibit 10.6 which shows the equilibrium price level and real GDP in an aggregate demand-aggregate supply model. Which of the following economic changes is depicted by a movement from point e to point e'?
A) an increase in short-run aggregate supply
B) an increase in long-run aggregate supply
C) a decrease in short-run aggregate supply
D) a decrease in long-run aggregate supply
E) an increase in the aggregate quantity demanded
Correct Answer:

Verified
Correct Answer:
Verified
Q2: If the price level in the current
Q3: If resource prices are "sticky" downward and
Q4: Workers usually negotiate compensation in terms of
Q5: If the price level in an economy
Q7: A situation in which workers and employers
Q8: Given implicit or explicit resource price agreements,
Q9: Which of the following is true of
Q10: When the economy's actual price level exceeds
Q11: Exhibit 10.1<br> <img src="https://d2lvgg3v3hfg70.cloudfront.net/TB1006/.jpg" alt="Exhibit 10.1
Q66: Suppose the real wage of a worker