Multiple Choice
In a one-factor ANCOVA, suppose the factor has two levels (groups) . Scatterplots of the dependent variable (Y) and the covariate (X) are generated (where group 1 is indicated by "•" and group 2 by "o") . Which of the following graphs shows the most desirable situation?
A) 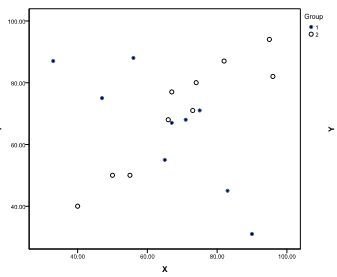
B) 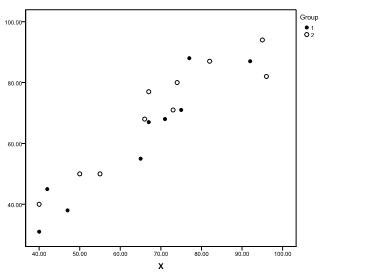
C) 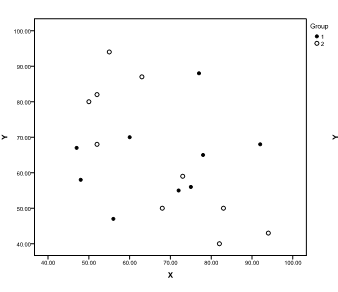
D) 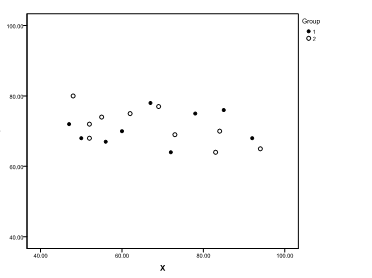
Correct Answer:

Verified
Correct Answer:
Verified
Related Questions
Q9: A market researcher wanted to know
Q10: For which of the following situations is
Q11: Susan runs an ANOVA using the covariate
Q12: Suppose out of budget concerns, the researcher
Q13: A researcher wanted to examine if soil
Q14: Mike wanted to examine whether people
Q15: A researcher wanted to examine if soil
Q16: A researcher wanted to examine if soil
Q17: A researcher wanted to examine if
Q18: Suppose the researcher used IQ as the