Multiple Choice
The 2011 Canadian Census at School project collected data on school-age children. The following scatterplot below the mean wrist circumference of boys according to age:
The form of the relationship in this scatterplot might best be described as
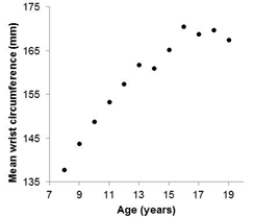
A) Negative.
B) Curved.
C) Linear.
D) Clustered.
Correct Answer:

Verified
Correct Answer:
Verified
Q12: The volume of oxygen consumed (in liters
Q13: Consider the following scatterplot:<br>What is the best
Q14: The volume of oxygen consumed (in liters
Q15: Tail-feather length in birds is sometimes
Q16: The protease activity found in walnuts
Q18: Bird species from temperate regions must cope
Q19: Which of the following statements about the
Q20: Bird species from temperate regions must cope
Q21: Five strains of the Staphylococcus aureus
Q22: Do creative people make better teachers?