Multiple Choice
The protease activity found in walnuts preserved in buffers of various pHs is listed in the following table:
?
?
Which of the following scatterplots is a correct representation of the data?
A) 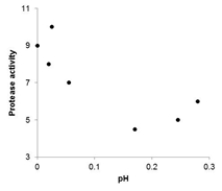
B) 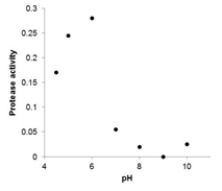
C) 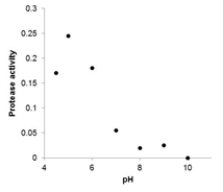
D) 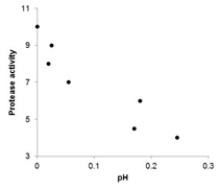
Correct Answer:

Verified
Correct Answer:
Verified
Related Questions
Q11: Bird species from temperate regions must cope
Q12: The volume of oxygen consumed (in liters
Q13: Consider the following scatterplot:<br>What is the best
Q14: The volume of oxygen consumed (in liters
Q15: Tail-feather length in birds is sometimes
Q17: The 2011 Canadian Census at School project
Q18: Bird species from temperate regions must cope
Q19: Which of the following statements about the
Q20: Bird species from temperate regions must cope
Q21: Five strains of the Staphylococcus aureus