Multiple Choice
Do creative people make better teachers? Ten teachers at a large university were given a creativity test (scores range from 0 to 20, with higher scores indicating greater creativity) and were evaluated regarding teaching performance by students and peers (a score of 100 indicates an average performance, and larger scores indicate better performance) . The creativity scores and teaching performance scores are given below.
?
?
Which of the following scatterplots would appropriately display these data given the research question?
A) 
B) 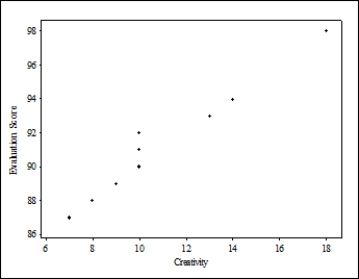
C) 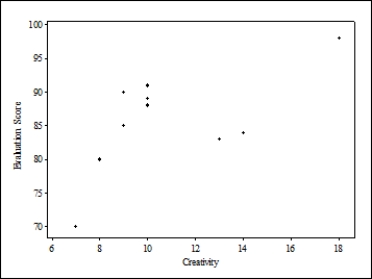
D) 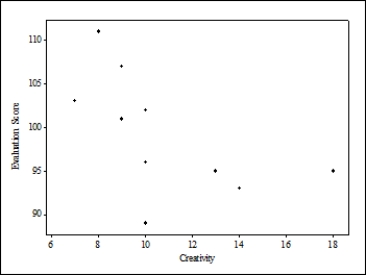
Correct Answer:

Verified
Correct Answer:
Verified
Q24: The protease activity found in walnuts
Q25: Tail-feather length in birds is sometimes
Q26: Five strains of the Staphylococcus aureus
Q27: Consider the following scatterplot of the infected
Q28: A researcher states that the survival time
Q30: Tail-feather length in birds is sometimes
Q31: Do creative people make better teachers?
Q32: Bird species from temperate regions must cope
Q33: Does atmospheric pressure have an impact on
Q34: A research study of approximately 13,900 incoming