Multiple Choice
Five strains of the Staphylococcus aureus bacteria were grown at 35 degrees Celsius for either 24 hours or 48 hours. Here are the resulting bacterial counts for each condition:
Which of the following scatterplots is a correct representation of these data?
A) 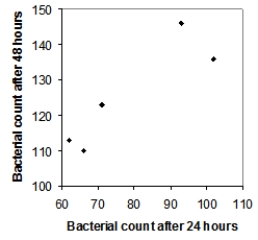
B) 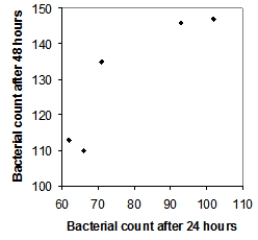
C) 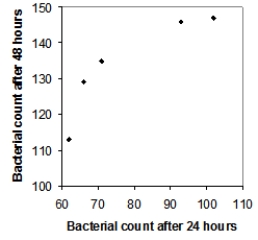
D) 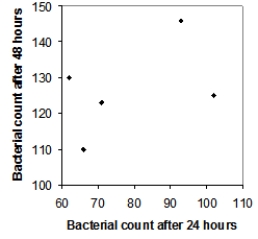
Correct Answer:

Verified
Correct Answer:
Verified
Q21: Five strains of the Staphylococcus aureus
Q22: Do creative people make better teachers?
Q23: The data in the following scatterplot are
Q24: The protease activity found in walnuts
Q25: Tail-feather length in birds is sometimes
Q27: Consider the following scatterplot of the infected
Q28: A researcher states that the survival time
Q29: Do creative people make better teachers?
Q30: Tail-feather length in birds is sometimes
Q31: Do creative people make better teachers?