Multiple Choice
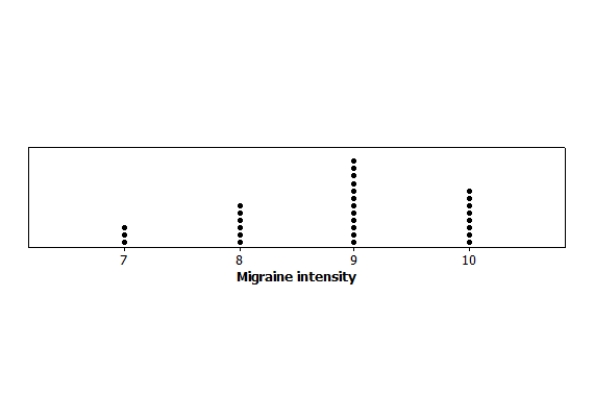
The following dotplot shows the migraine intensity (on a scale of 1 to 10) for 29 adults suffering from recurring migraines.
What is the first quartile for this data set?
A) 7.25
B) 7.5
C) 7.75
D) 8
Correct Answer:

Verified
Correct Answer:
Verified
Related Questions
Q8: Geckos are lizards with specialized toe pads
Q9: Stream ecologists are interested in the number
Q10: The following histogram shows the yearly number
Q11: Researchers measured the length of the central
Q12: Stream ecologists are interested in the number
Q14: Here is the ordered data of body
Q15: A sample was taken of the metabolic
Q16: The following dotplot shows the migraine intensity
Q17: A sample was taken of the metabolic
Q18: Which of the following data are likely