Multiple Choice
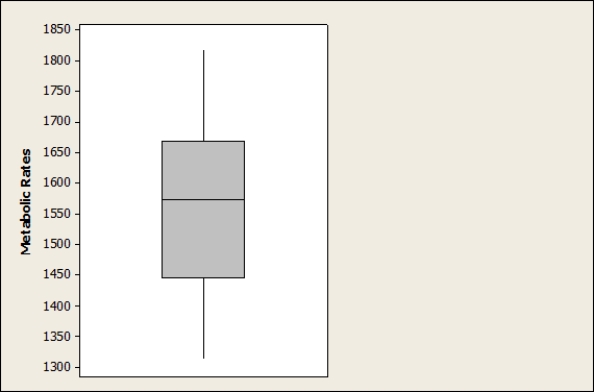
A sample was taken of the metabolic rates of men participating in a study regarding diets. The following boxplot depicts these rates (measured in kilocalories per 24 hours) .
If 25 points were added to each rate, how would the standard deviation of the new distribution of rates change?
A) The standard deviation would increase by 5.
B) The standard deviation would increase by 25.
C) The standard deviation would increase by 625.
D) The standard deviation would remain unchanged.
Correct Answer:

Verified
Correct Answer:
Verified
Q10: The following histogram shows the yearly number
Q11: Researchers measured the length of the central
Q12: Stream ecologists are interested in the number
Q13: The following dotplot shows the migraine intensity
Q14: Here is the ordered data of body
Q16: The following dotplot shows the migraine intensity
Q17: A sample was taken of the metabolic
Q18: Which of the following data are likely
Q19: Geckos are lizards with specialized toe pads
Q20: Stream ecologists are interested in the