Multiple Choice
The following Normal quantile plot displays the brain volumes of 30 autistic children: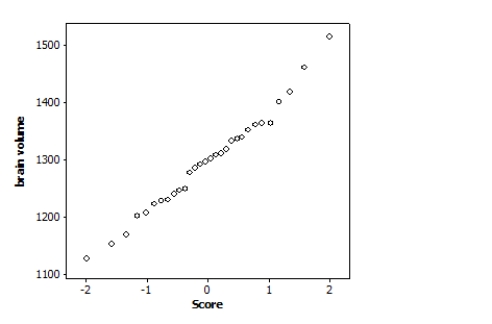 Based on this graph, what is the best description of brain volumes?
A) Linear
B) Roughly Normal
C) Bimodal
D) Skewed
Correct Answer:

Verified
Correct Answer:
Verified
Related Questions
Q1: A researcher was interested in the lengths
Q2: The heights of adult males are approximately
Q3: The distribution of total body protein in
Q4: Using your calculator, what is the area
Q5: A researcher is interested in the lengths
Q7: Using your calculator, what is the area
Q8: The lengths of 1-year-old girls can be
Q9: The distribution of total body protein in
Q10: The pH measurements of water specimens from
Q11: A researcher is interested in the lengths