Multiple Choice
A researcher was interested in the lengths of brook trout and obtained the following quantile-quantile plot for determining the Normality of the distribution: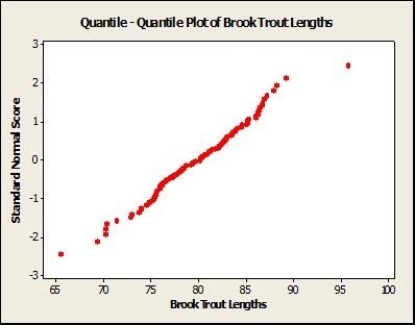 Based on this graph, what is the best description of the data?
A) Standard Normal
B) Normal, but not standard Normal
C) Skewed left
D) Skewed right
Correct Answer:

Verified
Correct Answer:
Verified
Q2: The heights of adult males are approximately
Q3: The distribution of total body protein in
Q4: Using your calculator, what is the area
Q5: A researcher is interested in the lengths
Q6: The following Normal quantile plot displays the
Q7: Using your calculator, what is the area
Q8: The lengths of 1-year-old girls can be
Q9: The distribution of total body protein in
Q10: The pH measurements of water specimens from
Q11: A researcher is interested in the lengths