Multiple Choice
The top graph in the figure below shows position vs time of an athlete performing a shuttle run (i.e. forwards and backwards) . Which of the four graphs below this (a - d) is most likely to represent the athlete's velocity vs time for the same movement? 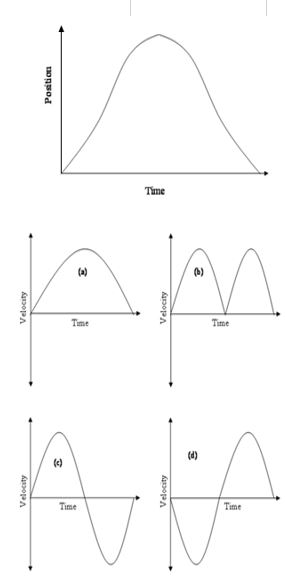
A) Image a
B) Image b
C) Image c
D) Image d
Correct Answer:

Verified
Correct Answer:
Verified
Related Questions
Q22: Use the equation 'Moment = force (Mass
Q23: Which of the following graphs would be
Q24: Speed and velocity cannot be measured in
Q25: Convert 3 hours 23.6 minutes into seconds
Q26: The centre of mass (COM) is defined
Q28: A pair of equal and opposite parallel
Q29: Convert 3 hours 23.6 minutes into hours
Q30: A golf ball is struck with a
Q31: Provide some examples of scalar quantities in
Q32: What is meant by the term linear