Multiple Choice
Which of the following graphs would be most likely to represent the relationship between velocity and the optimal angle of a projectile that is released from a higher position than it lands? 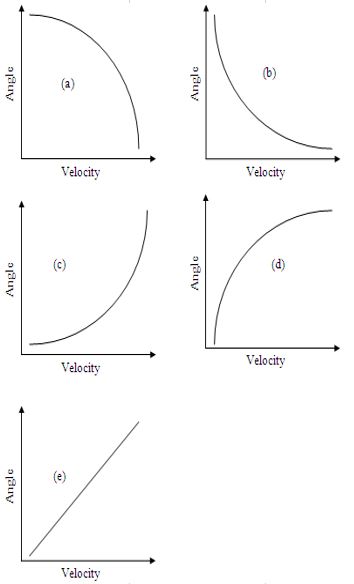
A) Image a
B) Image b
C) Image c
D) Image d
E) Image e
Correct Answer:

Verified
Correct Answer:
Verified
Related Questions
Q18: The centre of gravity (COG) is defined
Q19: An athlete is holding a 5kg dumbbell
Q20: Which of the following graphs most closely
Q21: Stability is decreased when the centre of
Q22: Use the equation 'Moment = force (Mass
Q24: Speed and velocity cannot be measured in
Q25: Convert 3 hours 23.6 minutes into seconds
Q26: The centre of mass (COM) is defined
Q27: The top graph in the figure below
Q28: A pair of equal and opposite parallel