Multiple Choice
Which of the following graphs most closely depicts the relationship between the take off velocity and the range (i.e. horizontal displacement) of a projectile? 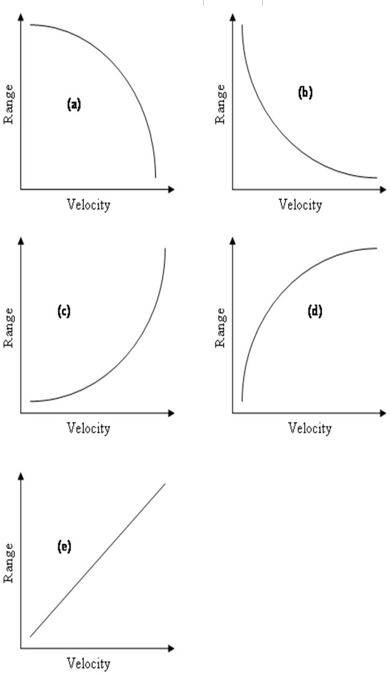
A) Image a
B) Image b
C) Image c
D) Image d
E) Image e
Correct Answer:

Verified
Correct Answer:
Verified
Related Questions
Q15: The centre of gravity in the human
Q16: How many yards are there in 1
Q17: Positive acceleration generally means 'speeding up' in
Q18: The centre of gravity (COG) is defined
Q19: An athlete is holding a 5kg dumbbell
Q21: Stability is decreased when the centre of
Q22: Use the equation 'Moment = force (Mass
Q23: Which of the following graphs would be
Q24: Speed and velocity cannot be measured in
Q25: Convert 3 hours 23.6 minutes into seconds