Multiple Choice
Figure 16-2 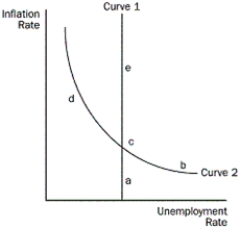
-Refer to the Figure 16-2.Where is the money supply growth rate the greatest?
A) at a
B) at b
C) at c
D) at e
Correct Answer:

Verified
Correct Answer:
Verified
Q15: What do the data for the period
Q104: According to Friedman and Phelps, when is
Q106: Figure 16-3 <img src="https://d2lvgg3v3hfg70.cloudfront.net/TB4801/.jpg" alt="Figure 16-3
Q109: Figure 16-4 <img src="https://d2lvgg3v3hfg70.cloudfront.net/TB4801/.jpg" alt="Figure 16-4
Q110: What is the long-run effect of an
Q113: Figure 16-3 <img src="https://d2lvgg3v3hfg70.cloudfront.net/TB4801/.jpg" alt="Figure 16-3
Q116: Figure 16-2 <img src="https://d2lvgg3v3hfg70.cloudfront.net/TB4801/.jpg" alt="Figure 16-2
Q128: How will a favourable supply shock shift
Q165: Suppose a policy increases the natural rate
Q197: In the late 1960s and early 1970s,