menu-iconExamlexExamLexServices

Discover

Ask a Question
  1. All Topics
  2. Topic
    Business
  3. Study Set
    Economics An Introduction
  4. Exam
    Exam 26: Scarcity and Choice Neoclassical View
  5. Question
    -The Production Possibilities Curve Depicted in Diagram 26
Solved

-The Production Possibilities Curve Depicted in Diagram 26

Question 53

Question 53

Multiple Choice

  -The production possibilities curve depicted in Diagram 26.1 reflects A)  increasing opportunity costs B)  decreasing opportunity costs C)  constant opportunity costs. D)  the absence of opportunity costs.
-The production possibilities curve depicted in Diagram 26.1 reflects


A) increasing opportunity costs
B) decreasing opportunity costs
C) constant opportunity costs.
D) the absence of opportunity costs.

Correct Answer:

verifed

Verified

Unlock this answer now
Get Access to more Verified Answers free of charge

Related Questions

Q48: Describe how the production possibilities curve captures

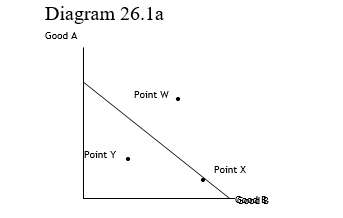
Q49: <img src="https://d2lvgg3v3hfg70.cloudfront.net/TBR1201/.jpg" alt=" -In Diagram 26.1a,

Q50: <img src="https://d2lvgg3v3hfg70.cloudfront.net/TBR1201/.jpg" alt=" -The production possibilities

Q51: Whats defention of terms:<br>-attainable region

Q52: Whats defention of terms:<br>-resources/inputs

Q54: Whats defention of terms:<br>-institutions

Q55: Whats defention of terms:<br>-constant marginal opportunity costs

Q56: Whats defention of terms:<br>-production possibilities curve (PPC)

Q57: Explain the concept of scarcity and how

Q58: What do economists mean by "technology?"<br>A) computers

Examlex

ExamLex

About UsContact UsPerks CenterHomeschoolingTest Prep

Work With Us

Campus RepresentativeInfluencers

Links

FaqPricingChrome Extension

Download The App

Get App StoreGet Google Play

Policies

Privacy PolicyTerms of ServiceHonor CodeCommunity Guidelines

Scan To Download

qr-code

Copyright © (2025) ExamLex LLC.

Privacy PolicyTerms Of ServiceHonor CodeCommunity Guidelines