Multiple Choice
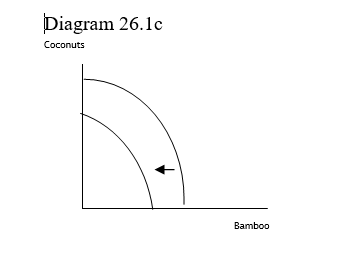
-The production possibilities curve shown in Diagram 26.1c reflects
A) constant opportunity costs
B) increasing opportunity costs
C) no opportunity costs.
D) unlimited resources.
Correct Answer:

Verified
Correct Answer:
Verified
Q45: Use the PPC to illustrate scarcity, choice,
Q46: <img src="https://d2lvgg3v3hfg70.cloudfront.net/TBR1201/.jpg" alt=" -The shift in
Q47: Use the PPC to illustrate scarcity, choice,
Q48: Describe how the production possibilities curve captures
Q49: <img src="https://d2lvgg3v3hfg70.cloudfront.net/TBR1201/.jpg" alt=" -In Diagram 26.1a,
Q51: Whats defention of terms:<br>-attainable region
Q52: Whats defention of terms:<br>-resources/inputs
Q53: <img src="https://d2lvgg3v3hfg70.cloudfront.net/TBR1201/.jpg" alt=" -The production possibilities
Q54: Whats defention of terms:<br>-institutions
Q55: Whats defention of terms:<br>-constant marginal opportunity costs