Multiple Choice
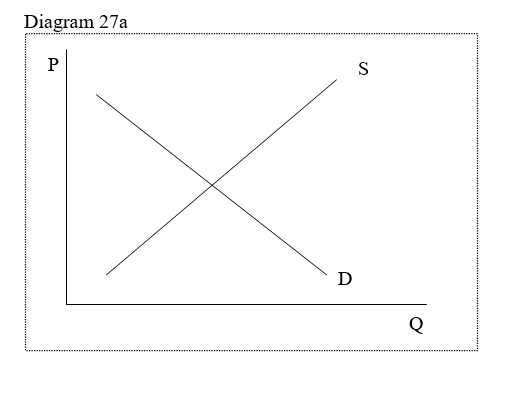
-In Diagram 27a, the demand curve represented by line D shows
A) that there is a positive relationship between price and quantity demanded.
B) that there is an inverse relationship between price and quantity demanded.
C) that the relationship between price and quantity demanded is both positive and inverse.
D) that the relationship between price and quantity demanded is circular.
Correct Answer:

Verified
Correct Answer:
Verified
Q2: Understand and describe what happens when a
Q3: Explain the limitations of elasticity (demand, supply,
Q4: Understand and describe what happens when a
Q5: Understand and describe what happens when a
Q6: Whats defention of terms:<br>-law of demand
Q7: Whats defention of terms:<br>-demand curve
Q8: Whats defention of terms:<br>-identification problem
Q9: <span class="ql-formula" data-value="\text { Table } 27
Q10: Whats defention of terms:<br>-perfectly inelastic
Q11: If the quantity demanded of good A