Multiple Choice
Which of the following graphs correctly represents a decrease in the risk premium on the MP curve?
A) 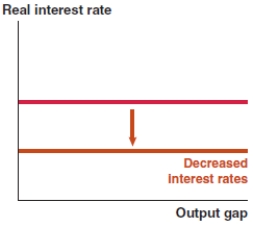
B) 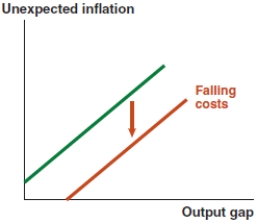
C) 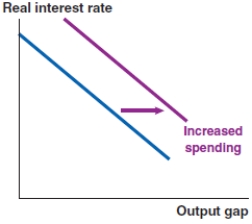
D) 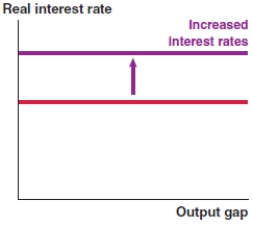
Correct Answer:

Verified
Correct Answer:
Verified
Related Questions
Q7: If the U.S. dollar appreciates, which of
Q8: You are an economic adviser using the
Q9: The third step in analyzing a macroeconomic
Q10: In the IS-MP analysis in the Fed
Q11: When using the Fed model to diagnose
Q13: When using the Fed model, the first
Q14: Graphically depict how financial shocks affect the
Q15: Which of the following graphs correctly represents
Q16: In the IS-MP analysis in the Fed
Q17: In the IS-MP analysis in the Fed