Multiple Choice
Which of the following graphs correctly represents a positive spending shock on the IS curve?
A) 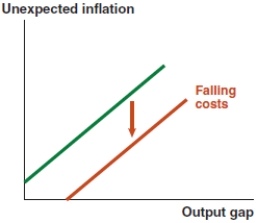
B) 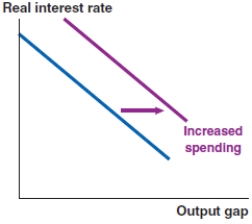
C) 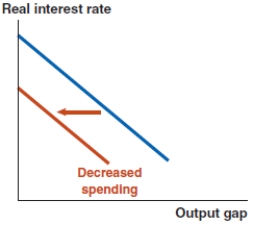
D) 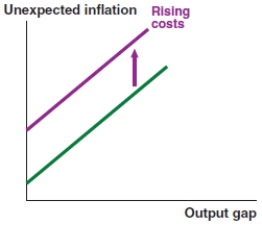
Correct Answer:

Verified
Correct Answer:
Verified
Related Questions
Q10: In the IS-MP analysis in the Fed
Q11: When using the Fed model to diagnose
Q12: Which of the following graphs correctly represents
Q13: When using the Fed model, the first
Q14: Graphically depict how financial shocks affect the
Q16: In the IS-MP analysis in the Fed
Q17: In the IS-MP analysis in the Fed
Q18: When using the Fed model to diagnose
Q19: As part of a stimulus package, the
Q20: Once you have connected the output gaps