Multiple Choice
Which of the following graphs correctly represents a positive supply shock on the Phillips curve?
A) 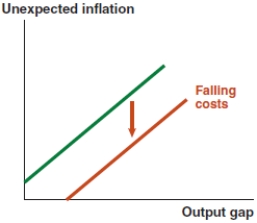
B) 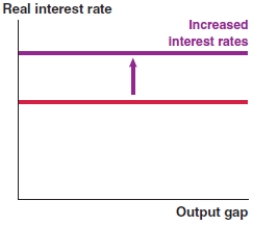
C) 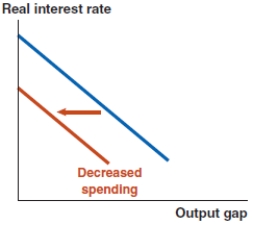
D) 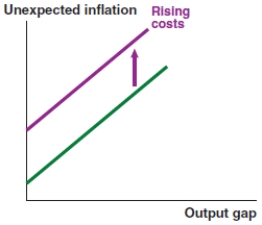
Correct Answer:

Verified
Correct Answer:
Verified
Related Questions
Q97: Once you have identified the output gap
Q98: Which of the following graphs correctly represents
Q99: If you see a newspaper headline that
Q100: When a spending shock occurs, the IS
Q101: A spending shock is any change in:<br>A)aggregate
Q103: In the IS-MP analysis in the Fed
Q104: If you see a newspaper headline that
Q105: Take a look at the IS-MP-PC model
Q106: Assume that the economy starts at a
Q107: Take a look at the IS-MP-PC model