Multiple Choice
Which of the following graphs correctly represents the effect on the MP curve in Canada if mortgage rates decrease?
A) 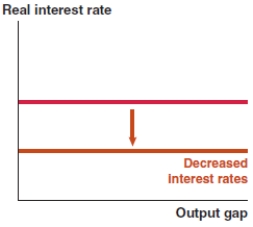
B) 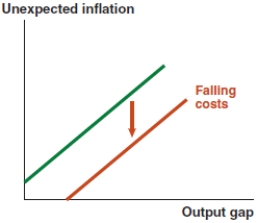
C) 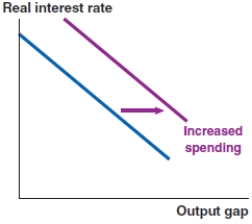
D) 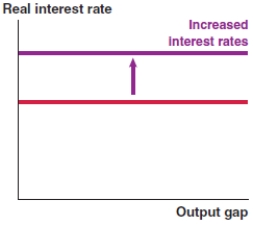
Correct Answer:

Verified
Correct Answer:
Verified
Related Questions
Q93: The economy shown here begins at a
Q94: You are an economic detective. Using the
Q95: The economy shown here begins at a
Q96: Once you have identified the point of
Q97: Once you have identified the output gap
Q99: If you see a newspaper headline that
Q100: When a spending shock occurs, the IS
Q101: A spending shock is any change in:<br>A)aggregate
Q102: Which of the following graphs correctly represents
Q103: In the IS-MP analysis in the Fed