Multiple Choice
If the government lowers corporate taxes, which of the following graphs correctly represents the effect on the IS curve?
A) 
B) 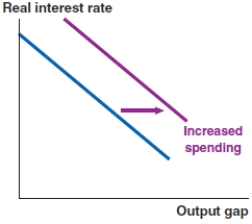
C) 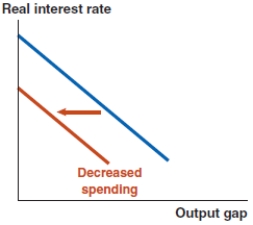
D) 
Correct Answer:

Verified
Correct Answer:
Verified
Related Questions
Q65: Take a look at the IS-MP-PC model
Q66: If the Canadian dollar depreciates, which of
Q67: The Fed model combines the _ curve,
Q68: You are an economic adviser using the
Q69: In the IS-MP analysis in the Fed
Q71: Consumers receive more disposable income. Analyze this
Q72: The economy shown here begins at a
Q73: Once you have identified the point of
Q74: If a spending shock reduces aggregate expenditure
Q75: In the IS-MP analysis in the Fed