Multiple Choice
If the Canadian dollar depreciates, which of the following graphs correctly represents the effect on the IS curve in Canada?
A) 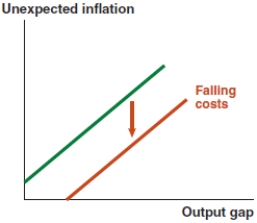
B) 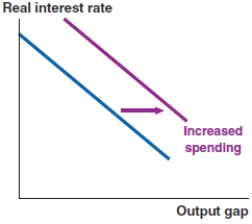
C) 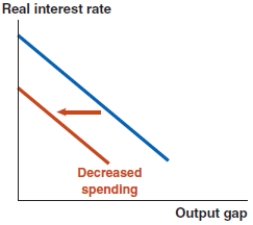
D) 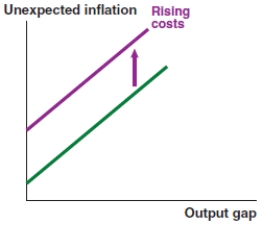
Correct Answer:

Verified
Correct Answer:
Verified
Related Questions
Q61: Graphically depict how spending shocks affect the
Q62: The economy shown here begins at a
Q63: Tariffs on inputs lead to a _
Q64: The 1973 OPEC oil embargo is an
Q65: Take a look at the IS-MP-PC model
Q67: The Fed model combines the _ curve,
Q68: You are an economic adviser using the
Q69: In the IS-MP analysis in the Fed
Q70: If the government lowers corporate taxes, which
Q71: Consumers receive more disposable income. Analyze this