Multiple Choice
Which of the following graphs correctly represents the effect on the MP curve if there is a rise in liquidity risk in the United States?
A) 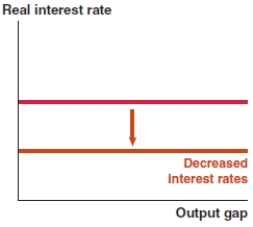
B) 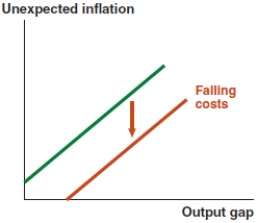
C) 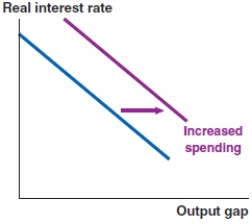
D) 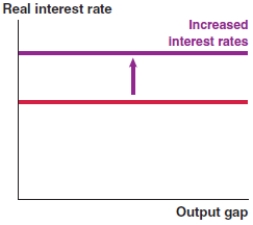
Correct Answer:

Verified
Correct Answer:
Verified
Related Questions
Q34: In the IS-MP analysis in the Fed
Q35: Assume that the economy starts at a
Q36: If a spending shock increases aggregate expenditure
Q37: The Fed model links the IS, MP,
Q38: Suppose the government increases taxes on corporations.
Q40: Take a look at the IS-MP-PC model
Q41: In the IS-MP analysis in the Fed
Q42: Explain the following concepts:<br>(a) financial shock<br>(b) spending
Q43: In the IS-MP analysis in the Fed
Q44: Suppose nominal wages fall in Bangladesh. Analyze