Multiple Choice
Assume that the economy starts at a 0% output gap. Now suppose that banks begin to fear the risk of default and the risk premium rises by 2%. Which of the following figures shows what happens in this scenario?
Figure A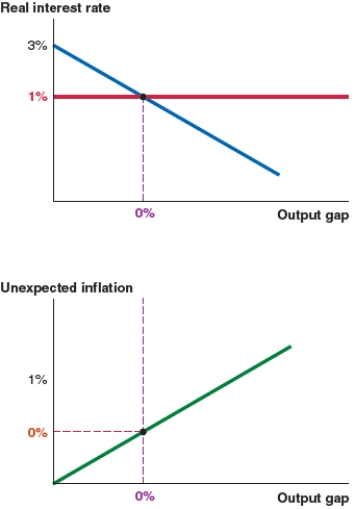
Figure B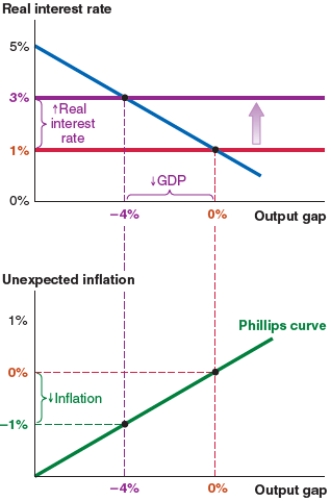
Figure C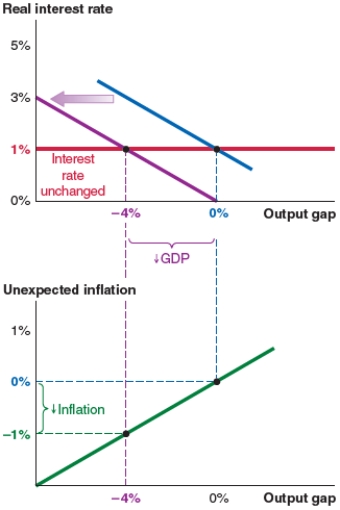
Figure D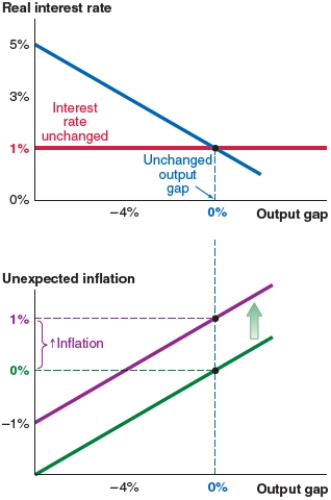
A) Figure A (no change)
B) Figure B (an upward shift of the MP curve and a new interest rate of 3%)
C) Figure C (a leftward shift of the IS curve and an output gap of -4%)
D) Figure D (an upward shift of the Phillips curve and 1% unexpected inflation)
Correct Answer:

Verified
Correct Answer:
Verified
Q30: If the real interest rate rises in
Q31: In the IS-MP analysis in the Fed
Q32: In the IS-MP analysis in the Fed
Q33: In 2017, nearly 3.5% of Vietnamese imports
Q34: In the IS-MP analysis in the Fed
Q36: If a spending shock increases aggregate expenditure
Q37: The Fed model links the IS, MP,
Q38: Suppose the government increases taxes on corporations.
Q39: Which of the following graphs correctly represents
Q40: Take a look at the IS-MP-PC model