Multiple Choice
(Figure: Market 4) Use the graph to answer the question.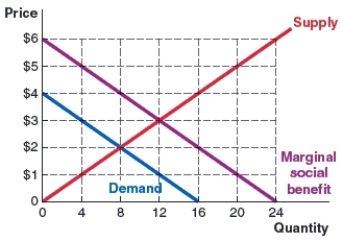
The graph shows the marginal social benefit, demand, and supply curves in the milkshake market are in the graph. What are the socially optimal quantity and price?
A) 12; $3
B) eight; $2
C) 12; $1
D) eight; $4
Correct Answer:

Verified
Correct Answer:
Verified
Related Questions
Q56: (Figure: Market 3) Use the graph to
Q57: Marginal social cost equals marginal _ cost
Q58: When a quota is used to control
Q59: Why would the government allow companies to
Q60: (Figure: Market 5) Use the graph to
Q62: Quotas change _, and taxes change _
Q63: What two characteristics are used to classify
Q64: When an activity has a side effect
Q65: A corrective subsidy is:<br>A)designed to internalize a
Q66: The socially optimal outcome is the outcome