Multiple Choice
(Figure: Market 5) Use the graph to answer the question.
The graph shows the marginal social benefit, demand, and supply curves in the toothbrush market. Market forces would yield a quantity of _____, whereas the socially optimal quantity is _____.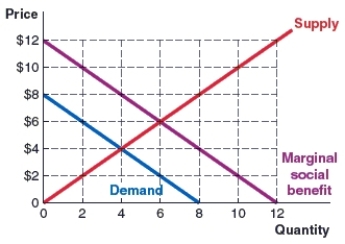
A) four; six
B) eight; four
C) six; four
D) four; eight
Correct Answer:

Verified
Correct Answer:
Verified
Q55: The idea that society should produce another
Q56: (Figure: Market 3) Use the graph to
Q57: Marginal social cost equals marginal _ cost
Q58: When a quota is used to control
Q59: Why would the government allow companies to
Q61: (Figure: Market 4) Use the graph to
Q62: Quotas change _, and taxes change _
Q63: What two characteristics are used to classify
Q64: When an activity has a side effect
Q65: A corrective subsidy is:<br>A)designed to internalize a