Multiple Choice
(Figure: Supply Curve for Olive Oil) Use Figure: Supply Curve for Olive Oil. The figure depicts a supply curve that is: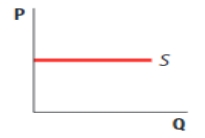
A) perfectly inelastic.
B) inelastic.
C) elastic.
D) perfectly elastic.
Correct Answer:

Verified
Correct Answer:
Verified
Related Questions
Q2: (Figure: Demand for High End Cell Phones)
Q3: Income elasticity of demand measures how responsive
Q4: If demand is _, a higher price
Q5: Suppose the percentage change in newspapers demanded
Q6: Price elasticity of demand measures how responsive
Q7: If a firm produces a product that
Q8: The price of a dozen eggs rises
Q9: (Figure: Supply Curves) The figure shows four
Q10: Suppose the price elasticity of demand for
Q11: Demand is more elastic when you are