Multiple Choice
Figure 7C
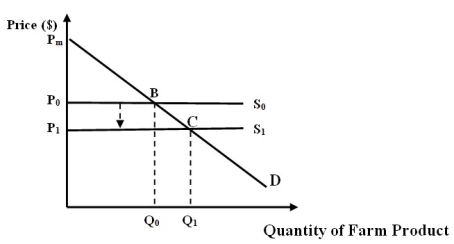
-Refer to Figure 7C. Assume that the farm product is grapes for wine-making. Which of the following reason(s) can result in a shift of the supply curve as illustrated in the figure?
A) Grape farms have improved access to water.
B) New, stricter environmental regulations improve air quality.
C) New, lax environmental regulations reduce air quality.
D) Both a and b
E) Both a and c
Correct Answer:

Verified
Correct Answer:
Verified
Q1: Willingness to pay (WTP) is a measure
Q2: The opportunity cost approach uses shadow prices,
Q4: A hedonic wage function can be used
Q5: The actual measurement of WTP requires information
Q6: Consumers' surplus is the difference between what
Q7: One cannot carry out a contingent valuation
Q8: If a specific forest ecosystem service can
Q9: If the MDC depicts the amount society
Q10: Figure 7A<br> <img src="https://d2lvgg3v3hfg70.cloudfront.net/TBR1466/.jpg" alt="Figure 7A
Q11: Figure 7C<br> <img src="https://d2lvgg3v3hfg70.cloudfront.net/TBR1466/.jpg" alt="Figure 7C