Multiple Choice
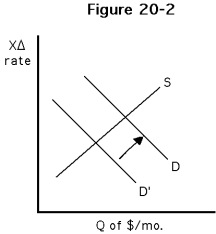 Which of the following would best explain the increase in demand for dollars illustrated in Figure 20-2?
A) An increase in U.S. prices, ceteris paribus
B) A decrease in U.S. interest rates, ceteris paribus
C) An increase in foreign incomes, ceteris paribus
D) An increase in foreign interest rates, ceteris paribus
Correct Answer:

Verified
Correct Answer:
Verified
Q1: <img src="https://d2lvgg3v3hfg70.cloudfront.net/TBR1053/.jpg" alt=" Which of the
Q2: <img src="https://d2lvgg3v3hfg70.cloudfront.net/TBR1053/.jpg" alt=" -Refer to Figures
Q3: Which of the following is not a
Q4: <img src="https://d2lvgg3v3hfg70.cloudfront.net/TBR1053/.jpg" alt=" -Refer to Figures
Q6: <img src="https://d2lvgg3v3hfg70.cloudfront.net/TBR1053/.jpg" alt=" -Refer to Figures
Q7: <img src="https://d2lvgg3v3hfg70.cloudfront.net/TBR1053/.jpg" alt=" -Refer to Figures
Q8: <img src="https://d2lvgg3v3hfg70.cloudfront.net/TBR1053/.jpg" alt=" -Refer to Figures
Q9: If the price of a new Rolex
Q10: A price index that measure the average
Q11: <img src="https://d2lvgg3v3hfg70.cloudfront.net/TBR1053/.jpg" alt=" Which of the