Multiple Choice
 Which of the following would best explain the increase in the supply of dollars illustrated in Figure 20-3?
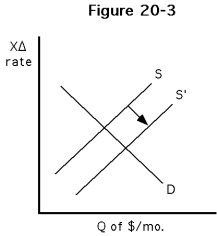
A) A decrease in U.S. prices, ceteris paribus
B) An increase in U.S. interest rates, ceteris paribus
C) An increase in U.S. incomes, ceteris paribus
D) An increase in foreign incomes, ceteris paribus
Correct Answer:

Verified
Correct Answer:
Verified
Q2: <img src="https://d2lvgg3v3hfg70.cloudfront.net/TBR1053/.jpg" alt=" -Refer to Figures
Q3: Which of the following is not a
Q4: <img src="https://d2lvgg3v3hfg70.cloudfront.net/TBR1053/.jpg" alt=" -Refer to Figures
Q5: <img src="https://d2lvgg3v3hfg70.cloudfront.net/TBR1053/.jpg" alt=" Which of the
Q6: <img src="https://d2lvgg3v3hfg70.cloudfront.net/TBR1053/.jpg" alt=" -Refer to Figures
Q7: <img src="https://d2lvgg3v3hfg70.cloudfront.net/TBR1053/.jpg" alt=" -Refer to Figures
Q8: <img src="https://d2lvgg3v3hfg70.cloudfront.net/TBR1053/.jpg" alt=" -Refer to Figures
Q9: If the price of a new Rolex
Q10: A price index that measure the average
Q11: <img src="https://d2lvgg3v3hfg70.cloudfront.net/TBR1053/.jpg" alt=" Which of the