Multiple Choice
Figure 12.4
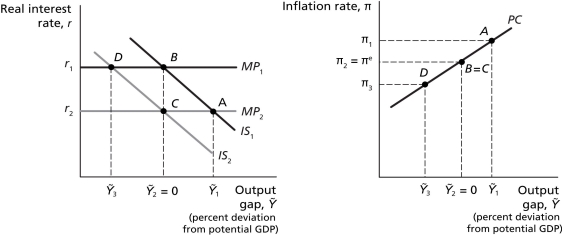
Scenario: The above figures represent the economy of Mondolvia, where points A, B, C, and D in the first figure reflect the corresponding points in the second figure. The economy of Mondolvia is initially at equilibrium with real GDP equal to potential GDP. In April 2012, Mondolvia reached the peak of a rapid housing bubble that dramatically increased consumer wealth. The central bank of Mondolvia recognized this housing bubble peak existed in June, 2012 and implemented corrective policy in August 2012. The corrective policy actually changed output in the economy 12 months after it was implemented. In the meantime, the housing bubble burst in December 2012, returning the economy back to its initial, pre-bubble equilibrium level.
-Refer to Figure 12.4.The implementation of corrective policy by the central bank is designed to move the economy from
A) point A to point B.
B) point B to point D.
C) point D to point C.
D) point C to point A.
Correct Answer:

Verified
Correct Answer:
Verified
Q15: With a contractionary monetary policy,as the output
Q16: Quantitative easing is a central bank policy
Q17: Figure 12.4<br> <img src="https://d2lvgg3v3hfg70.cloudfront.net/TB4177/.jpg" alt="Figure 12.4
Q18: Assume that the Bank of Canada knows
Q19: Assume it takes the Bank of Canada
Q21: Figure 12.3<br> <img src="https://d2lvgg3v3hfg70.cloudfront.net/TB4177/.jpg" alt="Figure 12.3
Q22: A study conducted by Alberto Alesina and
Q23: The Bank of Canada conducts open market
Q24: Which of the following is not one
Q25: In Canada,the preferred target for the inflation