Multiple Choice
Figure 12.4
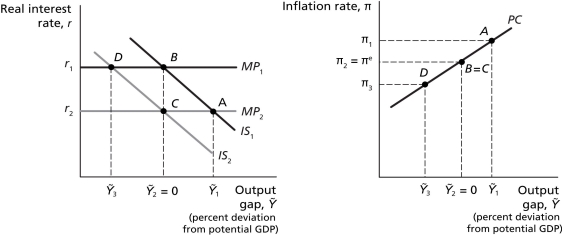
Scenario: The above figures represent the economy of Mondolvia, where points A, B, C, and D in the first figure reflect the corresponding points in the second figure. The economy of Mondolvia is initially at equilibrium with real GDP equal to potential GDP. In April 2012, Mondolvia reached the peak of a rapid housing bubble that dramatically increased consumer wealth. The central bank of Mondolvia recognized this housing bubble peak existed in June, 2012 and implemented corrective policy in August 2012. The corrective policy actually changed output in the economy 12 months after it was implemented. In the meantime, the housing bubble burst in December 2012, returning the economy back to its initial, pre-bubble equilibrium level.
-Refer to Figure 12.4.Since the housing bubble burst and the economy returned to its initial,pre-bubble level before the corrective policy changed output,the economy actually moved from ________ after the bubble burst.
A) point A to point B
B) point B to point D
C) point A to point C
D) point C to point B
Correct Answer:

Verified
Correct Answer:
Verified
Q73: The Board of Directors of the Bank
Q74: Assume that the term structure effect and
Q75: Under a fixed exchange rate system,if the
Q76: In general,if the Bank of Canada increases
Q77: What are the main arguments for and
Q78: Figure 12.1<br> <img src="https://d2lvgg3v3hfg70.cloudfront.net/TB4177/.jpg" alt="Figure 12.1
Q80: What are the effects of an expansionary
Q81: Some economists and policymakers criticized the Fed
Q82: Figure 12.3<br> <img src="https://d2lvgg3v3hfg70.cloudfront.net/TB4177/.jpg" alt="Figure 12.3
Q83: Through open market operations,the Bank of Canada<br>A)